Find your way around reports
Open Reports from the left menu, pick a report, set the dates and location, choose columns, and download exactly what's on screen as a CSV file.
Reports turn your schedule, time clock and requests into figures you can filter and download. To open them, select Reports in the left menu. What you see depends on your role:
- Owners and operations administrators see every report, for the whole organization.
- Location managers see every report, for the locations they manage.
- Assistant managers see Overview, Scheduled vs Actual and Tasks, and can't download them.
- Employees don't have reports.
The list of reports
The list beside the page groups the reports:
- Overview: headline figures for the range. Select a card to open the report behind it.
- Time: Scheduled vs Actual, Attendance and Paid time off.
- Staffing: Coverage, Availability and Below scheduled coverage.
- Shifts: Tasks and Shift feedback.
- Labor: Estimated labor cost and Payroll exports.
Choose the dates and locations
- Select a range: Last 7 days, Last 30 days, This week or Last week. Or enter From and To, then select Apply range.
- Under Location, select one location or All locations. Location managers see every location here, but only their own have data.
- Where the report offers them, choose a Position and a Group by option, such as Day, Week or Location.
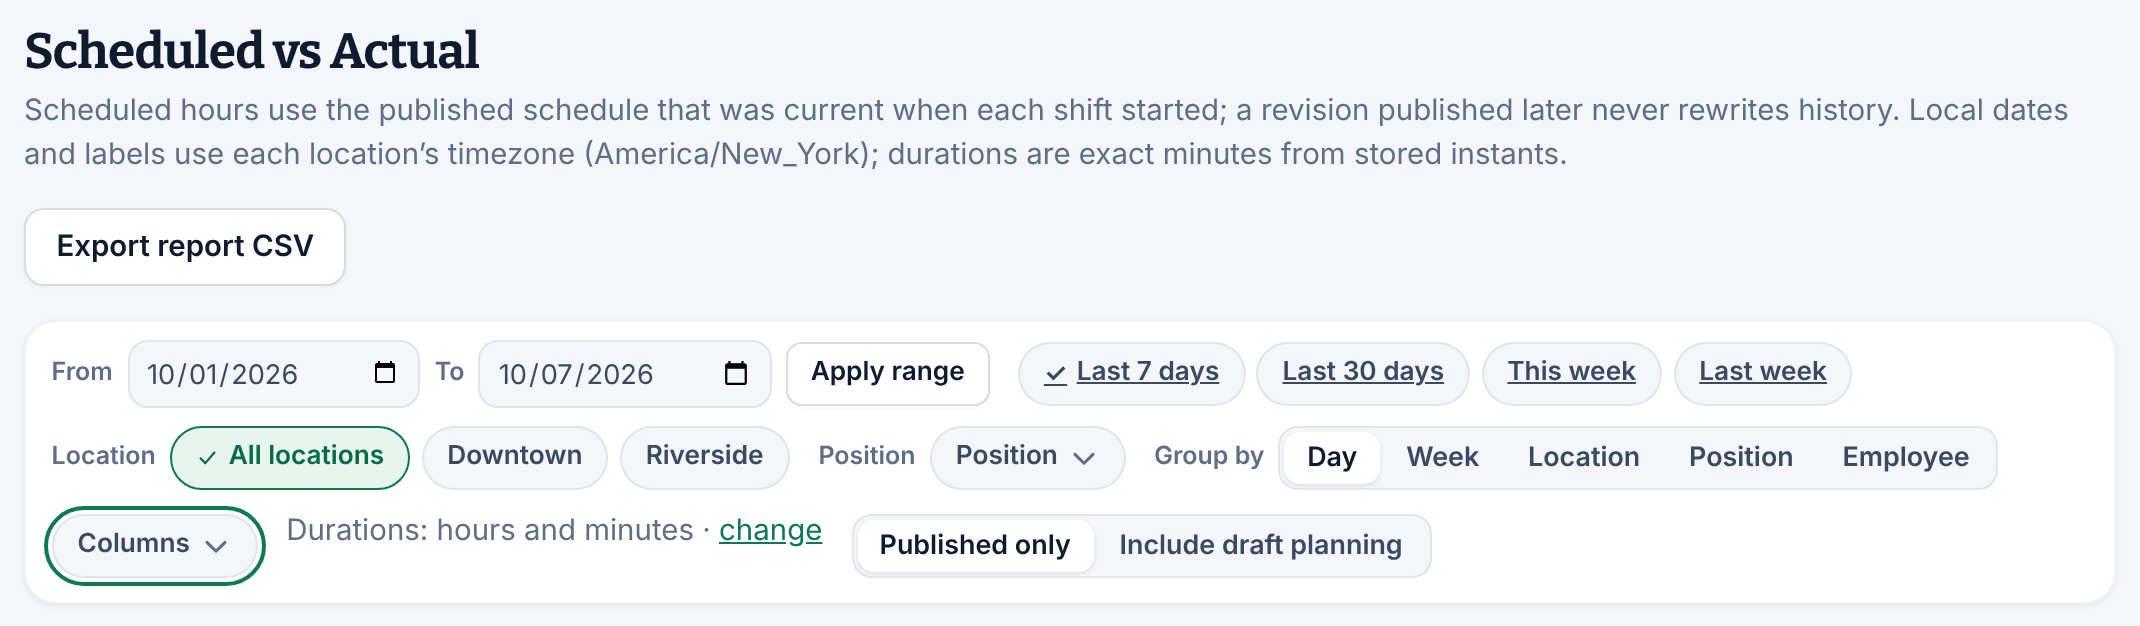
Not every report has every control. Changes apply right away, except From and To, which wait for Apply range. Your choices go with you when you switch to another report. To go back to the last 7 days with no filters, select Reset.
Choose the columns
- Select Columns.
- Untick the columns you don't need, and use the arrows to change their order.
- To hide the total at the bottom, untick Show totals row.
Shift Amp remembers your columns for each report in this browser.
Download a CSV file
Select Export report CSV. On reports with several tables, each table has its own Export CSV.
The file holds exactly what's on screen: the same dates, filters, grouping and columns, in the same order. The totals row isn't included. Durations follow your duration format in Settings (hours and minutes, or decimal hours), and amounts of money are in cents.
Read the figures
- The line under the filters says whether the figures include time from timecards that aren't approved yet: "includes provisional (unapproved) time data" or "approved time data only".
- On reports about hours, Data completeness lists anything that's missing, such as days with no published schedule or people still clocked in.
- A dash (—) means unknown, never zero.
- If a report says "Something went wrong", try a shorter range. Overview and Below scheduled coverage cover up to about three months at a time; the other reports cover up to a year.
Was this article helpful?